概述
今天主要介绍怎么用zabbix来监控windows CPU使用率及磁盘IO,下面一起来看看吧~
1、监控Windows-CPU使用率
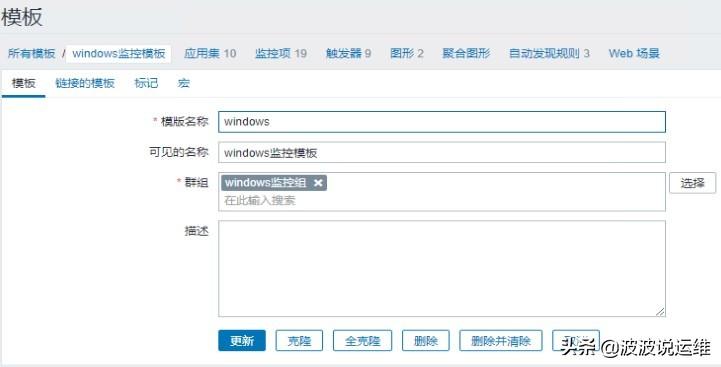
1.1、创建模板
在zabbix中,默认的模板不带CPU使用率的监控,为减少重复工作率,在template模板下创建一个模板
然后模板直接关联相关的模板即可!
在配置---->模板---->创建模板

1.2、创建监控项
名称:CPU usage%
键值:perf_counter[\Processor(_Total)\% Processor Time]
信息类型:浮点数
单位:%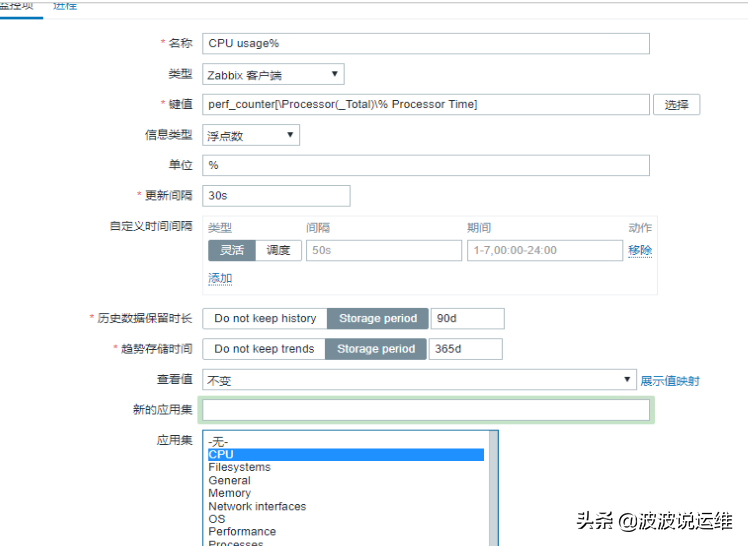
1.3、创建触发器
在表达式构造器测试这个触发器是否有用
名称:cpu used is more than 80%
严重性:一般严重
表达式:{windows:perf_counter[\Processor(_Total)\% Processor Time].avg(5m)}>80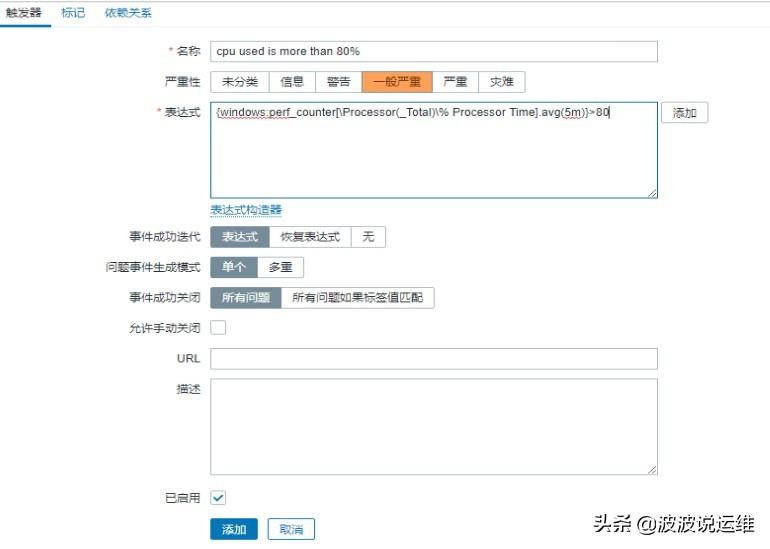
1.4、创建图表
名称:CPU使用率
监控项:windows监控模板: CPU usage%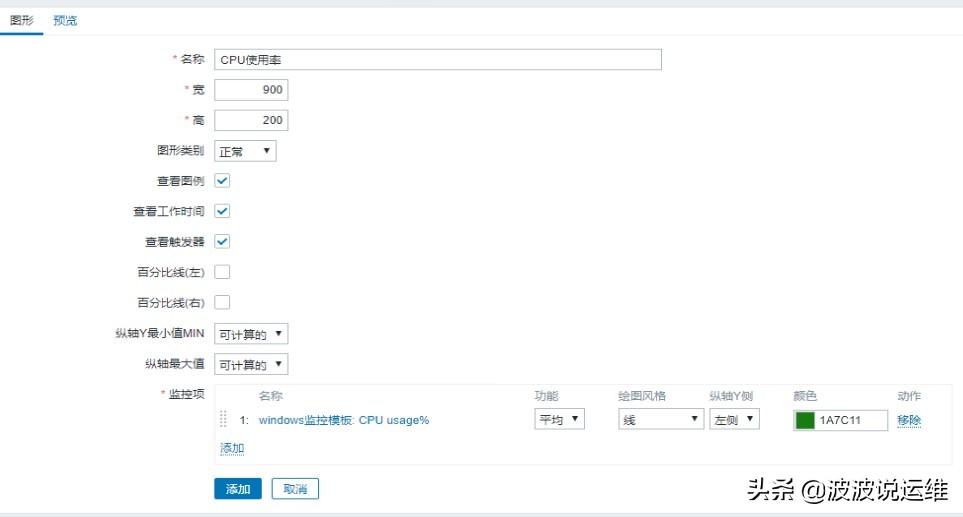
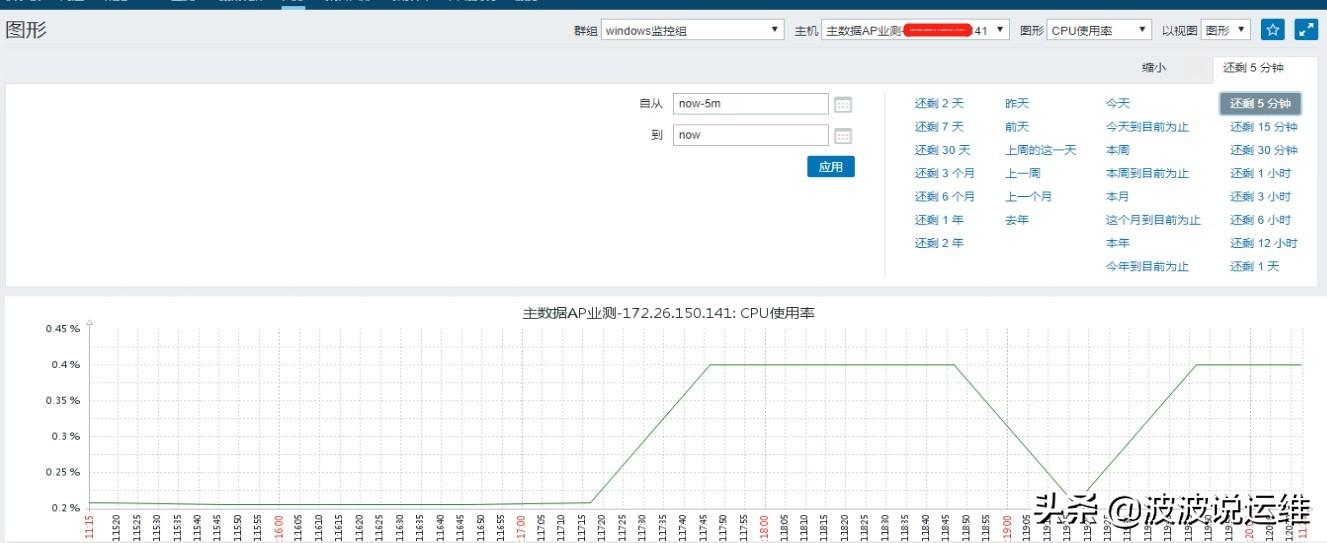
添加成功以后可以查看CPU图形表了,有数据代表成功监控了!
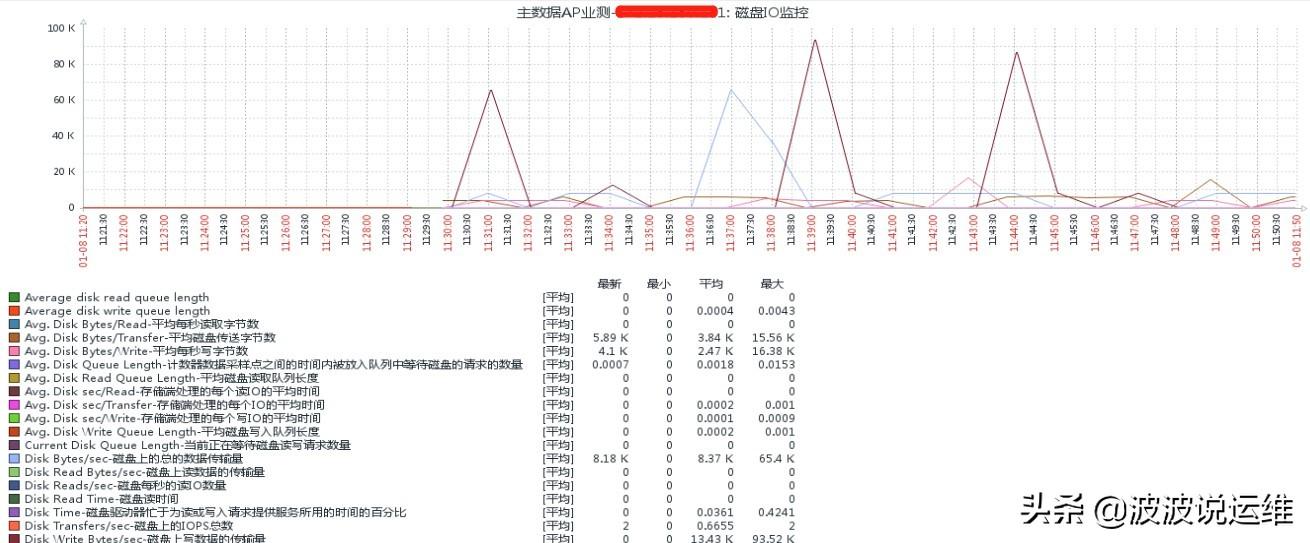
2、监控Windows磁盘IO
WIN下的IO性能监控,是通过调用性能计数器中的参数来获取。
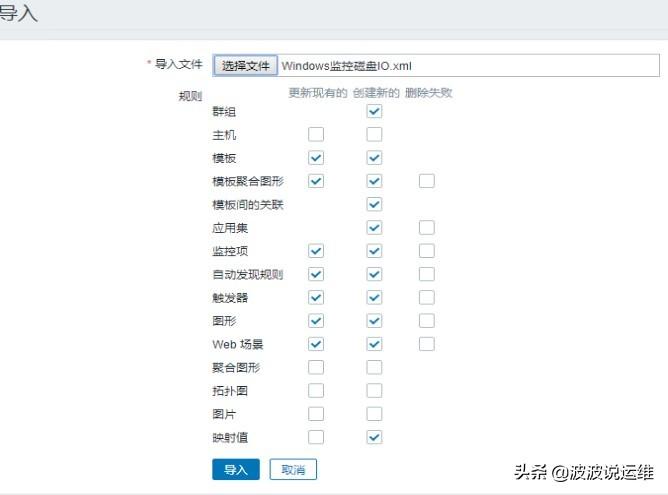
2.1、下载监控模板并导入
模板下载地址:https://files-cdn.cnblogs.com/files/Sungeek/Windows监控磁盘IO.xml注意:这个IO模版是收集整个服务器所有物理硬盘的IO数据的
比如:服务器有一个固态硬盘,一个机械硬盘,他是固态硬盘和机械硬盘数据加起来显示出来,监控数据库服务器的时候,最好分别对待固态硬盘和机械硬盘,使用不同的触发器阀值
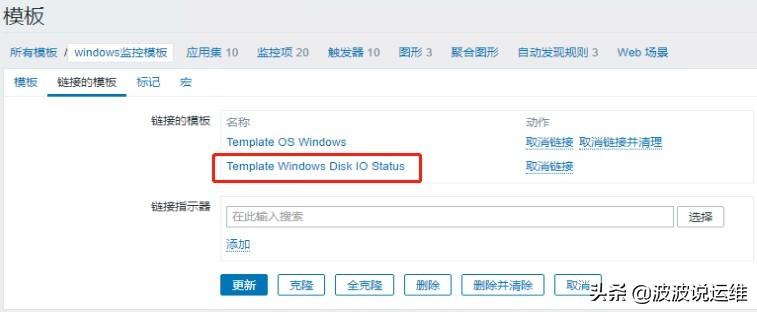
2.2、关联模板
2.3、配置图表
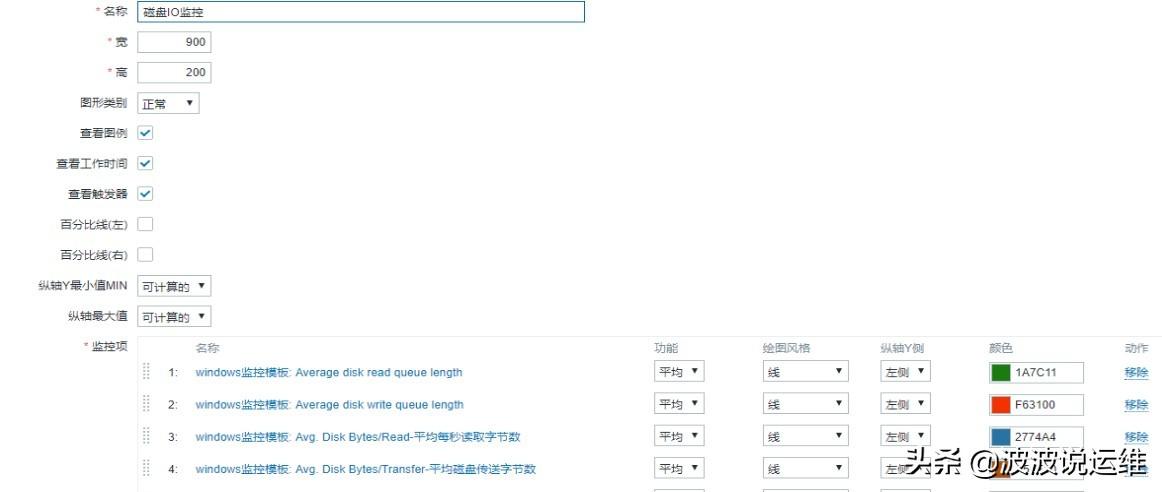
2.4、查看图形